

Do you remember your first cellular phone? It was likely a bulky device that flipped open and only let you make calls. Today, your cell phone looks nothing like your first one. Vibration analyzer condition monitoring instruments are following a similar path of evolution, albeit at a slower pace. The change is part of a paradigm shift in the predictive maintenance (PdM) industry. It is moving toward new technologies, cloud computing, data sharing, visibility and program metrics.
Condition Monitoring Tools History
Industrial instruments were initially designed as monolithic, purpose-built meters that collected data. They were plain, heavy-duty, rubber-booted boxes. Some wires extruded (possibly attached to a sensor) to attach to a measurement location. These box-like meters made specific measurements, such as voltage or resistance. If you needed to make a different type of measurement, you needed a different meter.
While they remained purpose-built and monolithic, industrial instruments underwent two major technology changes over the past 50+ years. In the 1960s and 1970s, their design shifted from all analog components to digital technology. In the 1980s, instrument manufacturers began embracing microprocessors to control and expand the functionality of portable meters. The rise of personal computers, also in the 1980s, enabled data to be easily exchanged with a local PC workstation. This resulted in a new generation of “smart” instrumentation. Vibration condition monitoring tools followed this same path. Vendors who did not see or appreciate the paradigm shift disappeared from the market.
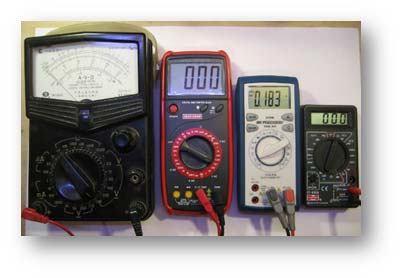 Image 1. Data collection devices have come a long way from these single-measurement instruments.
While the underlying technology changed, the operational process remained the same. A PdM analyst or technician collected vibration data with the analyzer. He then returned to his office to unload the data to a computer. Then he manually analyzed it using proprietary desktop software.
Some vendors continue to operate that way today. However, others have recognized the technology advances made by tablet computer and mobile phone manufacturers. They found ways to capitalize on them to benefit condition monitoring instruments and customers’ PdM programs.
Thought leaders in the industry have adopted an “if you can’t beat them, join them” attitude. These vibration analyzer vendors are incorporating commercial-off-the-shelf (COTS) tablet computers and smartphones into their designs. This allows their focus to be developing data acquisition and diagnostic capabilities. Not the development of another computer and user interface.
The results are evident in today’s market. There are vibration analyzers with features that were unheard of in the industry 20 years ago. Touch screens, built-in cameras and video recorders, GPS, wireless communications, remote access and voice control abilities are readily available.
Condition monitoring instruments built upon tablet computers have the added benefit of being part “regular” computer. Besides being able to collect and analyze vibration data, the tablet can be used for other purposes. Got a lubrication application that you usually bring to the shop floor on a PDA? Why not load it on your analyzer instead? The possibilities are only limited by the tablet’s space and processing power – and the plant’s IT security policies.
Need to access hazardous locations? No problem! Many vendors offer rugged tablets and smartphones that meet hazardous use requirements.
Surprisingly, the ruggedized versions of commercially available tablets and smartphones are holding up well in harsh industrial environments. It seems the devices that many considered novel toys when they first emerged are actually tough. After all, they have to hold up under the daily abuse of teenagers.
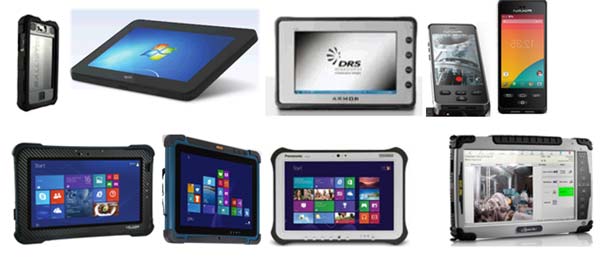 Image 2. Many mobile phone and tablet manufacturers have rugged devices that can hold up to harsh plant environments.
Condition Monitoring Instruments Physical Design Matters
Ergonomics, efficiency and comfort are key factors in almost everything we use to accomplish our work. A computer programmer, for example, will be less effective if his desk chair is uncomfortable and too low. Sore muscles, headaches and stiff joints will likely distract him from his work and negatively impact his productivity.
The same is true for vibration analyzers. The weight of the device, how it is carried and how it operates have a direct impact on the efficiency of the person collecting data.
Monolithic, purpose-built condition monitoring instruments are typically heavier. They have a poor display-area-to-weight ratio, though some vendors’ latest offerings are a bit lighter. The bulkiness and weight of the meter should be considered when making a purchase. After all, the user will be carrying it around for hours at a time. She may be climbing and reaching to access measurement points.
New technology has given rise to a two-component design that makes the unit less taxing on muscles and joints. Using a COTS tablet that communicates wirelessly with a separate data processing unit has a number of advantages. These include lower cost of ownership and safer form function. An accelerometer is connected to the small data processing unit. It can be worn on a belt or placed near the machine. The user only needs the tablet — weighing less than 3 pounds — in his hand to initiate collection.
This design reduces the weight and bulkiness of the condition monitoring equipment. It also allows the operators to distance himself from the machine. The user can connect the accelerometer to the machine and leave the data processing unit near the machine. Then he can step away to use the cable-free tablet to trigger collection.
When moving between machines, sensors and cables can be completely holstered in belt pockets. This leaves both of the technician’s hands free. The person collecting data is not concerned with dangling sensors and cables from the top of the condition monitoring instruments. This typically forces him to secure them with one of his hands.
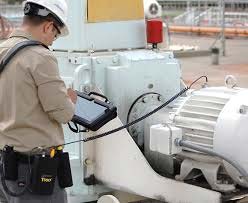 Image 3. The two-component design enables a technician to wear a small data acquisition device on a belt. This leaves his hands free to trigger collection via a tablet computer.
Mobile phones and smartphone apps are slowly emerging. They are alternatives for technicians to communicate data to a remote data center, perform operator or lubrication rounds, or make helpful vibration-related calculations.
Many new condition monitoring instruments are being introduced, such as:
- rugged smartphone or tablet coupled to a separate data acquisition device.
- self-contained smart sensor that communicates wirelessly to an iPad or smartphone.
- smartphone that pushes data to the cloud from a traditional-looking condition monitoring instrument that makes the measurements.
Lowering Lifecycle Costs
The physical design of condition monitoring instruments directly affects their lifecycle cost.
Most facilities replace their purpose-built, monolithic vibration analyzers every five to 10 years. This means buying a whole new condition monitoring instrument for $15,000 to $35,000. This is after paying annual support fees between $1,500 and $3,000 over the life of the “old” analyzer.
For the two-component design, separating signal processing from the human interface lets vibration analyzer vendors take advantage of advances in computer technology. As faster, more powerful tablets and smartphones emerge, vendors can offer them to customers at a much lower cost. Typically, new technology makes the “old” model obsolete in about two or three years’ time. Consider your last mobile phone. How long did you have it before upgrading to the shiny new model?
The two-component design data processing unit can be replaced less frequently than the tablet/smartphone component. Typically about every 10 years or longer. This is because the signal processing requirements for portable vibration data collection condition monitoring instruments are mature and well understood. The following is unlikely to change or be improved in any way that would necessitate a new design for route-based analyzers:
- Four parallel channels of data acquisition with frequency ranges up to 40 kHz and lines of resolution up to 25,600.
- Flexible sampling and triggering modes on tachometer or vibration signals.
- Ability to accept accelerometers, proximity probes, and other types of sensors.
For purpose-built, monolithic meters, most of the design work is focused on staying current with computer component advances. However, the customer base is not large enough to support rapid redesigns. Once you buy, you are likely frozen at that level of computer technology for years. Think about the analyzer currently used in your plant. How long ago was it purchased?
The following chart shows the 12-year, lifecycle cost of the two-component design compared to two other traditional models.
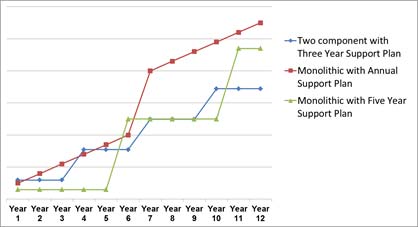
Keep in mind that as costs of tablets and smartphones drop, so do lifecycle costs for the two‑component design. The estimated lifecycle cost of two-component systems is between 20 and 30 percent less than the lifecycle cost of monolithic systems. This assumes an average replacement cycle for traditional data collectors, even with earlier and more frequent computer tablet refresh cycles.
Increased Availability & Enhanced Support
Being without your vibration analysis condition monitoring instruments can be difficult. Especially if you have bad actors in your fleet and production deadlines to meet. If your analyzer is on the fritz and technical support cannot help you over the phone or via email, you will likely ship it to the vendor for repair or replacement. Historically, this meant you would be without your analyzer for weeks. Unless your vendor offered a loaner program and you were up to date with your support plan payments.
The two-component design does a lot to alleviate this pain:
- The tablet or smartphone of a two-component analyzer can be repaired or replaced for $2,000 to $4,000 in a matter of days. (The tablet and smartphone industries are expected to deliver this type of turnaround to almost any location around the world.)
- You can purchase a spare tablet or smartphone component as a backup, to maximize the availability of your unit.
- The data acquisition unit of a two-component analyzer has a very simple, rugged design and is less expensive to replace or provide loaners for as compared to a purpose-built, monolithic analyzer.
- Repair or replacement of either component of two-component design is less costly than a monolithic device. Plus, it is highly unlikely that both components would fail at the same time.
Internet-enabled condition monitoring instruments built upon a tablet or smartphone also provides an important advantage relative to technical support. Imagine a two-component analyzer that can be accessed remotely by its technical staff over the Internet because the tablet is a Windows-standard, internet enabled device. The tech support staff can troubleshoot the device or assist the customer with a difficult situation, such as setting up an advanced test. In many cases, this negates the need to ship the analyzer to the vendor for troubleshooting.
Bring Data to the Analyst
The paradigm shift in condition monitoring instruments plays directly into an increased need to communicate predictive maintenance information and the concept of “cloud computing.”
To a maintenance team responsible for ensuring maximum machine uptime, it begs the question: What’s the benefit of cloud computing to me and my program?
The benefit of the cloud to a maintenance team is huge. Storing vibration data in the cloud enables access by a broader audience. This can be multiple analysts inside a single plant or across many plants, or a third-party PdM provider who is geographically remote. The cloud enables data to be delivered to people, rather than having to transport people to the location where the data is being generated.
Another major benefit of cloud storage is having the data backed up securely. Cloud storage means your data has little to no risk of loss, especially if your data collector and/or analysis software synchronizes with the cloud. Synchronization ensures both locations have the same information. This means that if the analyzer or the computer housing the diagnostic software fails, an exact copy of your entire database is backed up in the cloud. (The only risk is losing the vibration data collected just before the failure – if it has not been synched to the cloud.) Most cloud-storage providers also back up their servers, adding an extra layer of protection.
To reap the benefit of cloud storage, a condition monitoring instrument must be designed to transfer data over the Internet. Some vibration analyzers on the market today make it seamless, with just a click of a button and an Internet connection. Other OEMs including both industrial asset manufacturers and metering manufacturers have deployed smartphone applications as a transfer tool.
However, many of today’s analyzers are not Internet-enabled at all. Some are designed for sharing via a LAN, which is limiting since everyone you want to access the data must be on the same LAN.
For vendors that have embraced the cloud, it is also important to consider the diagnostic software needed to analyze the data. The cloud concept supports a variety of new software configurations – all of which promote collaboration and data sharing:
- Local Installation: Diagnostic software is installed on the analyst’s desktop or on a network server. A local database synchronizes to a database in the cloud. Multiple analysts can have individual copies of the diagnostic software, all of which synchronize to the cloud to enable sharing of information and collaboration.
- Cloud Installation: Diagnostic software is installed in the cloud with the data. Analysts access it via a Web subscription over the Internet. A synchronized copy of the cloud database resides on each analyst’s vibration analyzer.
- Analyzer Installation: Diagnostic software is installed on the analyzer itself. A keyboard, mouse, and monitor (for those who prefer a larger screen for diagnostics) can be connected– essentially eliminating the need for a separate diagnostic computer. Data from the analyzer is synchronized with a copy of the database in the cloud so others can access it, too.
The cloud concept drives efficiency no matter how your program is set up.
For an in-house program with a single analyst, PdM in the cloud enables the analyst to stay on top of things, regardless of his location. He can go on vacation and be able to analyze machine data collected by his staff from anywhere with an Internet connection. If a company has more than one analyst located at different sites, they can collaborate on analysis. Without centralizing the data in the cloud, each analyst’s data would be accessible only on an individual’s computer after being unloaded from their meter or over a LAN.
For outsourced programs, the third-party PdM provider can send a technician to collect data (or train someone in-house) and then have an expert analyst remotely perform diagnostics on the data. This model saves the plant money, as the expert analyst does not have to travel to the site. Even if the PdM vendor sends a tech to collect the data, it is much less expensive than a visit from the expert analyst. It also saves time. No longer does the plant have to wait nervously wait while an analyst makes a long drive or hops a on a plane to come analyze problematic equipment. Simply collect and send the data to him via the cloud.
The design of today’s condition monitoring instruments plays a key role in the success of the PdM in the cloud model.
When the purpose-built, monolithic data collectors were designed originally, there were no formal standards relative to how the meter should operate from a hardware perspective. If you switched vendors, you had a brand new device to learn. One did not operate like the next.
The incorporation of COTS tablets and smartphones removes this usability barrier. Today’s tablets and smartphones are designed to be easy-to-use right out of the box and tend to follow similar usability standards. Most children can pick up any tablet or smartphone and figure out how to use it within a few minutes.
By reducing the learning curve, a technician can be taught how to collect quality data in a very short time. Separating collection from diagnostics lets analysts focus on remote analysis with the confidence that quality data has been collected.
Condition Monitoring Example:
Imagine a PdM provider that services large industrial companies with 100 or more sites distributed throughout the United States. The onsite staff has been trained on how to collect quality data with condition monitoring instruments.
Each month, all 100 sites collect and send data via the Internet to the cloud. It is reviewed by the vendor’s analysts, who produce comprehensive reports for each plant that describe the faults found and recommend corrective actions.
Corporate-level managers at the company log on to a web portal to see an overview of machinery health across all of the plants and can drill down into the portal for more details. All of the reports are posted on the portal for easy access.
This visibility shines a light on sites where collections are skipped, as it is tracked on the portal. Correlations can be made between sites with higher ratesof machine failures and low data collection compliance. Corporate managers are able to clearly see the value of their PdM program.
Visibility into the Predictive Maintenance Program
PdM in the cloud is not new. Companies have been using it for more than a decade. What has changed is its use from basic data sharing to something much more.
As mentioned previously, the cloud enables data to be shared with a broader audience and drives visibility into PdM programs.
A plant’s PdM budget needs to be justified each budget season to continue. Showing a return on investment is not always easy, especially if you have a mature, strong program that catches problems early. Many maintenance managers can relate to hearing: “We’ve had very little downtime this past year, so why do we need this line item for a PdM program?” It is often the first thing cut in a bad economy.
PdM Web portals that work in conjunction with vibration analyzers support the tracking of metrics, from how many faults were detected, to their severity, to the time it took to repair. There are even ways to track costs savings from avoided downtime.
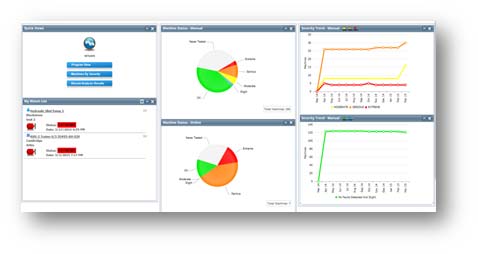 Image 5. Web portals aggregate information from various data collection sources and provide visibility across one or many plants via data-driven metrics.
Having this type of information readily available arms the maintenance manager with the facts and figures he needs to show just how effective his program is and tout how much downtime cost was avoided.
For a maintenance manager in charge of multiple facilities, these metrics also help him better manage his vibration program by tracking whether data collection is occurring on schedule and by comparing the time to repair across sites. A Web portal can also show the current statuses of machines across many plants so the manager gets a complete picture of corporate-wide machinery health, rather than a piecemeal view.
Solving the Expertise Shortage Problem
Many studies have shown that the available diagnostic expertise within plants is dwindling. Many skilled analysts are nearing retirement and there are not enough new analysts to fill their shoes.
The need to solve the expertise shortage problem is one of the driving factors behind the paradigm shift in the PdM industry, including changes in condition monitoring instruments. Remote analysis enabled through cloud computing and Web-enabled vibration analyzers lets one expert analyst service many geographically dispersed customers. If the analyst had to make monthly or quarterly visits to collect and analyze data on-site, he would not be nearly as effective or be able to help as many disbursed sites.
For those who do not outsource, having a condition monitoring instrument that integrates with a Web portal means historical machine health information is not lost when the in-house analyst leaves or retires. While other systems can offer a new PdM manager a database full of data and a slew of past reports, a Web portal aggregates and displays an intuitive picture of the site’s history, which saves lots of time and headaches.
Many PdM programs simply die off when their champions leave. When the program is brought back, usually after a string of unexpected machinery failures, it starts from scratch – sometimes even with a new brand of vibration data collector and software. The new paradigm of PdM helps keep that from happening. Not only can a Web-based PdM system be easily outsourced when talent is lost, it can also easily be re-started by a new hire since all of the data and history is available on the portal and the data collection unit is intuitive and easy to use.
Ten years from now, young analysts will look at today’s purpose-built, monolithic vibration analyzers and consider them as old fashioned as we consider those clunky flip phones. The new generation of PdM personnel will arrive on the job already tablet and smartphone savvy, expecting and embracing the latest technologies.
Today’s paradigm shift to Internet-enabled condition monitoring instruments and cloud-based storage will eventually become the norm. Management will increasingly demand visibility into program metrics on a corporate scale as it realizes the efficiency gains possible through “big data.”
Whether we embrace these changes – or go kicking and screaming – there’s little doubt that technology improvements will continue to drive PdM and its condition monitoring instrumentation into the cloud.
While a lot is changing, one thing remains a constant. That is the need to sustain a solid PdM program that ensures maximum uptime and gives maintenance staffs ample warning of needed repairs.
This article was previously published in the Reliable Plant 2016 Conference Proceedings.
By Ken Piety, Azima DLI