
 It is well-known that performing maintenance on a condition-based maintenance or reliability-centered basis is the preferred method of plant maintenance operation. This method is the most cost-effective, safest and the objective for most organizations. But how does one begin the journey?
Why a Reliability Office?
In 2012, the site was operating on a reactive maintenance basis. Equipment was in continuous failure mode. The mill repaired the equipment on the premise of getting it running as soon as possible, and subsequent failures of the same equipment were not considered. The years of reactive maintenance caused the mill to become the worst performer in the fleet, which in turn lowered the morale of the mill and raised the cost of operation.
As part of the mill revitalization effort, the movement from reactive maintenance to condition-based maintenance was identified as an important step. It is from this movement the reliability office was created. The reliability office is a team of personnel trained in condition-monitoring techniques and technologies whose work is dedicated to searching for equipment faults and pending failures. This team recommends corrective actions for their findings and performs root cause analysis of failures.
The original team consisted of an engineer, two mechanics, two electricians and a lubrication attendant. The focus of the reliability office was the tissue manufacturing department. As the team experienced success and reduced delays with assets in tissue manufacturing, it expanded its area of responsibility to other areas of the mill. The expanded responsibilities caused the team to grow. Today, the reliability office consists of a team leader, a mechanical engineer, three mechanics, two electricians and two lubrication attendants.
Defining the Vision and Mission
The broad assignment for the reliability office was to improve equipment reliability in tissue manufacturing. We felt, as a team, that we needed to have a common vision of the end state we were attempting to achieve. Our vision was to drive the Fullerton Mill from a reactive/preventative maintenance culture to a proactive/root cause elimination maintenance culture through condition-based maintenance.
Once we had our vision, we had to define how and what we would do to make our vision a reality. We created a mission statement that would define our actions and connected it to our mill’s objective. Our mission was to increase the reliability of the Fullerton Mill assets and deliver business results through the creation of sustainable best-in-class condition-monitoring programs.
How and Where to Begin Condition-Based Maintenance
Simply having a vision and mission statement would not be enough. We had to start the mission. With a daunting mission and a wide range of tactics and strategies, it could have been overwhelming. The idea of implementing all the various condition-monitoring technologies (vibration, lubrication, ultrasound, motor current analysis, etc.) at once did not appear to be the best strategy. We knew we wanted to focus on two or three technologies at the start, become very proficient and then add another strategy each year. Whichever technology was selected, we knew that a sustainable condition-based maintenance program would require the proper equipment, training, systems development and documentation.
The Fullerton Mill had a similar condition-monitoring program in the past, but it was abandoned by mill leadership in a cost-cutting effort. Thus, we did not need to create everything new. Perhaps we could build on what may have existed or still exists at the mill. We began with three questions:
1. What equipment did we already have?
Answer: Four laser alignment tools, four hand-held vibration analyzers and two infrared cameras.
2. What previous training or experience did we already have?
Answer: One or two people were trained and experienced with vibration analysis, two to four people with laser alignment and one with an infrared camera.
3. Were there any systems currently in place?
Answer: No formal condition-monitoring programs existed, but we did have SAP. Within SAP, there existed routes for lubrication, oil sampling, vibration and infrared at various intervals.
Based on the answers to these questions, we decided to begin with lubrication, vibration and infrared. We had a base knowledge, equipment and some routes in SAP for vibration and infrared, which made these two technologies a good choice.
We chose lubrication over laser alignment because it is the key to equipment health. Lubrication affects almost all equipment and can be practiced every day. Laser alignment is a higher skill that can be taught but only practiced with limited opportunities. Lubrication is the foundation upon which all other condition-monitoring technology programs are built. Without proper lubrication, it would not matter what other condition-based maintenance programs were created, as all the equipment would be in the constant state of failure.
Lubrication
Before the reliability office, lubrication of the equipment was the responsibility of the operators. The operators had little to no lubrication training, and there were no checks in place to confirm the lubrication activities were completed. The mill would regularly experience equipment failures due to lack of or improper lubrication. Some failures were minor, while others were catastrophic to the equipment and/or asset.
We began our lubrication program with a third-party audit and assessment of the mill’s lubrication program, along with training all team members to International Council for Machinery Lubrication. A combination of the information in the assessment and the knowledge from the MLT Level I training became the basis of the lubrication program.
The team reviewed all the lubrication routes that existed in SAP. Equipment that was no longer in service was removed from the routes documentation. Routes were consolidated for ease of application and collection by the lubrication attendant. The mill’s lubricants were consolidated where possible. The benefits of the lubricant reduction were numerous, including less inventory, lower costs and reduced risk of applying the improper lubricant.
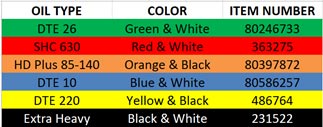
To implement visual management in the lubrication program, color-coding of lubricants and labeling of equipment was performed across the department. The color codes for the mill’s oils are shown below.
Devices were installed on equipment for ease of daily inspections. These included 3-D bull’s-eye sight glasses, bottom sediment and water bowls, desiccant breathers and sight glasses.
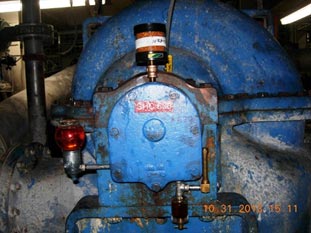
To control contaminants on larger equipment, disconnects were installed to fill and drain the units. Sample ports were also installed on most equipment for consistent sampling and contamination control. Sampling equipment and procedures were then developed for consistency and prevention of cross-contamination. The procedures were documented, and the lubrication attendants were trained on the procedures.
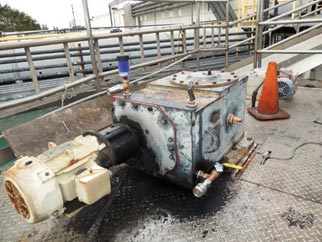 Gearbox with contamination control devices
The mill had a lab for oil analysis under contract. The test slate was very generic and did not fit the application of the mill’s oils. The standard response time from sample collection to receipt of results was 10-14 days. A new test slate was devised from the application for MLT Level I training. This test slate was the basis for a request for bids from a number of oil analysis laboratories near the mill. A laboratory was selected, tested and then placed under contract. The time from sample collection to receipt of results was reduced to three to five days, and the cost per sample was reduced by 63 percent, which was equivalent to $26,000 in annual savings.
When the equipment’s sample rate was reviewed, the interval rate was found to be variable. The sample rate for critical equipment was set to monthly, while the sample rate for most other equipment was set to bi-monthly. Sampling routes were created to meet the intervals defined and for ease of collection. The routes were leveled to have approximately the same number of samples taken each month. Leveling ensured that the sampling technique was used regularly and performed consistently. This also allowed ease of adding samples to routes for follow-up sampling or additional monitoring of particular equipment as needed. The sampling procedure was formalized and documented. The sampling procedure ensures each lubrication attendant is trained in the same manner and provides consistent samples.
The daily rounds and oil analysis results drove corrective actions. Corrective actions were as simple as lubricant leaks and as complex as large bearing changes. To reduce the frequency of oil changes, two oil purifiers were purchased. The purifiers were moved from equipment to equipment to perform kidney filtering of the oil while the equipment continued to operate. An added benefit of the lubrication attendant rounds was all the other corrective actions found, from water leaks to unusual equipment vibration or temperatures.
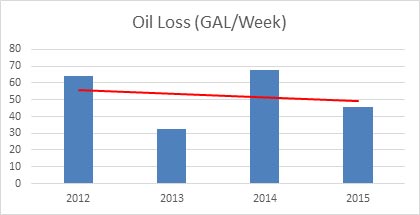
One of the biggest advantages of the condition-based maintenance and lubrication program, other than equipment uptime, is the reduction of oil loss in the department. There were some leaks that required significant time for repair or procurement of replacement parts that affected the timing for correcting the leaks. During 2012 and 2013, only the oil loss in the five large recirculating oil tanks was tracked. Beginning in 2014, the oil loss in the entire department was tracked, no matter which piece of equipment oil was added. This metric helped to measure the effectiveness of the corrective actions and the sustainability of the lubrication program.
Over the past three years, oil loss was reduced from 65 gallons per week to 45 gallons per week, a 30-percent reduction. That is equivalent to 988 gallons of oil per year with a cost savings of $10,000 annually. The oil loss reduction not only impacts the cost of operation but also the safety of the mill. Oil on the floor and equipment presents slip, environmental and fire hazards.
The program’s long-term sustainability has been improved by the recent construction of a world-class centralized lubrication room and the development of formal procedures for the receipt of lubricants, initial testing of oils, subsequent handling, filtering and dispensing. All of these procedures have been captured in written documentation for regular auditing of the process and for future training.
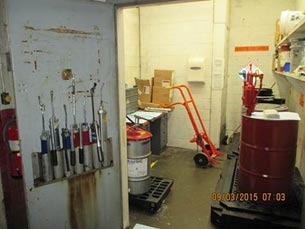 Previous Lubricant Storage
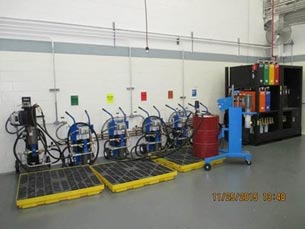 The New Centralized Lubrication Room
Vibration
Before the reliability office and condition-based maintenance, a single mechanic would perform vibration rounds sporadically. The findings from the vibration analysis would often go ignored. Equipment would fail even when there were indications that failure was eminent, but no action would be taken.
The reliability office revitalized the vibration program by first going back to basics. The mill changed the vibration operating system to the corporate standard equipment and software. This allowed sharing of information and techniques among the mills. Routes were standardized on four-week intervals and reconfigured for ease of data collection. All vibration technicians were trained and certified to ISO Level II.
In the following months, an online vibration monitoring system was installed, and critical equipment within the asset was wired to the online system. Data was collected once every 24 hours and reviewed each day. The vibration measurement points that were not easily accessible or could not be collected without violating safety rules had permanent mounted sensors and were wired to a local switch box. All wiring for the online system and the local switch boxes were documented in the corporate drawing system, and all boxes were labeled. Other manually collected points had targets installed to facilitate consistent sensor placement for manual routes.
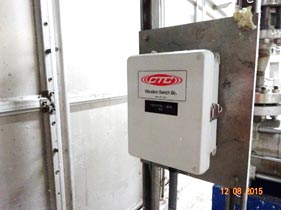 Remote Vibration Connection Box
The vibration program was more complex than the lubrication program, primarily due to the equipment and software required. The vibration technicians received additional training on the equipment and software directly from the manufacturer. A full system and program description was written to document the flow of data and the function of each piece of hardware and software. Procedures and documentation for all vibration data collection were formalized. Included in the documentation were the special vibration test techniques, such as phase analysis and synchronous time averaging. The use of the advanced vibration analysis techniques aided in the identification of equipment faults, including unbalance, misalignment and soft foot.
The sector created a condition-based maintenance network in which the mill actively participates. The network has monthly calls with other mills that focuses on the application of technologies. The technicians share their findings, root cause analysis results, application of techniques and equipment, and any issues they may be having with their tools. The initial focus of the network was vibration and ultrasound but now includes infrared and precision alignment.
Through continued training on vibration equipment and software, we have learned of other applications where the equipment can be utilized. Use of the vibration system has been expanded to perform minor motor current analysis and infrared monitoring. These other applications have been set up in the database and regularly scheduled routes.
Infrared Thermography
Before the reliability office, the infrared thermography program consisted of a yearly survey of all motor control centers which was driven by corporate insurance requirements focused on power distribution. This work was always outsourced, and every year several critical and severe issues were found.
After the team completed thermography training, routes were created to perform surveys of all the motor control centers, critical drives and PLC panels on a semi-annual basis. These routes and surveys were more thorough than the yearly insurance surveys and were focused on reliability. The routes were configured based on cabinet locations as opposed to which equipment was being powered. This increased the efficiency of the inspections and reduced waste. The routes were leveled so technicians perform thermography routes each month.
When the infrared routes began, a large number of reliability issues were found in many panels. Some of the issues were loose wires, unlubricated switches, broken fuse holders and unbalanced loads. In the beginning of the program, many of the faults were deemed critical or severe. After the first 18 months, the number of reliability issues within the panels decreased significantly. Now, the rate at which issues are found in panels are one to three a quarter.
When the 2015 annual survey for the insurance company was performed by the reliability office, none of the findings was deemed critical or severe.
Working with open power cabinets exposes technicians to arc flash hazards. To eliminate this safety risk, infrared windows were installed on cabinet doors to allow the inspections to occur without opening the cabinet doors.
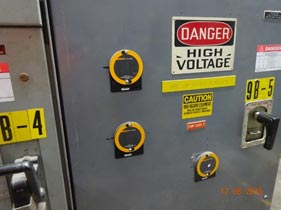 Infrared windows on motor control cabinet to mitigate arc flash
Thermography surveys were not limited to electrical inspections. Rounds were set up to inspect the mill’s steam traps on a bi-monthly basis. The first year of inspections yielded the repair or replacement of almost all of the steam traps. Many bypass circuits and valves were found to be faulty or in the incorrect position. Ultrasound was introduced about six months into the steam trap survey program, and both tools were utilized in the steam trap surveys. The ultrasound would confirm steam trap faults and reveal faults that went undetected with thermography.
Thermography was further expanded to mechanical inspections of the asset. Condition-based maintenance routes were established to the asset’s survey areas. These routes identified numerous faults, including bad bearings, failed check valves and air leaks. This technology was also employed in tissue machine hood surveys. Leaks could be detected from a safe distance, limiting the technician’s exposure to the heat from the hoods.
Precision Alignment
As the reliability office became proficient with the initial three condition-based maintenance technologies — lubrication, vibration and thermography — the focus turned to the development of skills with precision alignment. Formal training was conducted for not just the reliability office members but also for other mechanics and all of the mechanical engineers in the mill.
Precision alignment consisted of shaft alignment and soft foot. Before the reliability office, precision alignment focused on shaft alignment only and ignored soft foot. Best practices were developed and documented for precision alignment, base plate design, and foundation and grouting.
Precision alignment was a technology and practice that was easily tied to engineering practices. Many aspects of equipment design and installation practices to improve shaft alignment and to minimize the effect of soft foot can be addressed at the design level. This promoted designing for reliability instead of attempting to improve the reliability of the equipment after installation and startup.
Root Cause Failure Analysis
Before the reliability office and condition-based maintenance, the mill repaired equipment to an operational state, but most would fail again soon thereafter. Failed components would be thrown away without investigating what may have caused the failure. When failed components were inspected, no documentation or sharing of the information occurred. The mill’s reaction to failures was to create a preventative maintenance inspection or replacement based on a time interval. This resulted in repetitive failures of the same or similar equipment and a proliferation of preventative maintenance work that could not be completed within the mill’s work capacity or the asset’s planned downtime.
The reliability office began to investigate failures on major equipment. Root causes were identified and documented in root cause failure analysis reports. The reports were shared with everyone in maintenance, engineering and operations within the department. Since the mill is one of six in the sector with similar assets and producing a similar product, the reports were also shared with the maintenance and reliability leaders at other mills. The reliability office developed and authored the sector root cause failure analysis framework, which included the report structure and communication upon completion.
The purpose of the investigations was to identify equipment fixes that could prevent a repeat failure on the same equipment and where the same type of failure might occur on similar equipment elsewhere in the mill. Countermeasures were developed for each failure. These ranged from the development of new assembly standards, application of precision maintenance techniques and new equipment designs.
Root cause failure analysis was used for the repetitive failure of felt rolls on the tissue machine. The bearings on three of the rolls failed after being in service for only a few months. The expected service life of the bearings on the rolls was in excess of five years. The root cause failure analysis investigation found that although the bearing housings appeared to be within specification when simply measuring the inner diameter, the housings were actually out of round and thus out of specification. The out-of-round bearing housings caused fretting corrosion of the bearings and would fail prematurely. New bearing housings were ordered with new specifications for roundness.
Team Synergy
The reliability office provided the mill with a team of condition-based maintenance technicians that interacted on a daily basis. The technicians and engineers worked together to confirm equipment faults utilizing multiple condition-monitoring technologies and to develop corrective actions.
Most typically, ultrasound was utilized as a confirmation of a suspected bearing fault. If an elevated temperature or vibration was detected, ultrasound would be used to discern a fault versus a lack of lubrication or alignment. The combined use of condition-based maintenance technologies would help drive the proper corrective action. Having the team members trained on each of the technologies enabled better communication and ease of interaction between the members.
For example, a lubrication attendant found metal shavings in the oil filter of the recirculating oil system. Unfortunately, there were three separate pieces of equipment operation on the recirculating system, servicing a total of 15 bearings. Which piece of equipment was failing? The vibration technician utilized vibration data to narrow it down to a single piece of equipment, which consisted of two bearings, each of which could be changed independently. One bearing would require two days to change, while the other would take five days to change. Bearing faults could be seen in each vibration signature.
So which bearing was failing? Ultrasound was employed to discern which bearing was experiencing the faults. Ultrasound revealed that only one bearing had faults. A regularly scheduled shutdown of the asset was planned a few days later. During the planned downtime, the reliability office condition-based maintenance team used a borescope on the suspect bearing and confirmed the failing bearing.
Bad Actors
When an equipment fault is found, it is added to a bad actor list. A bad actor is defined as a piece of equipment that is in progress of a known failure mode and has a corrective action plan to address the failure.
The bad actor list was initially published weekly, but after 12 months the frequency of communication to the condition-based maintenance teams was changed to monthly. The initial frequency was due to the volume of equipment faults being identified. As more and more equipment had their root cause countermeasures applied, the number of equipment faults began to decrease each month.
The bad actor list includes the following:
- The department and asset where the equipment resides,
- The name of the equipment,
- The equipment fault,
- The severity rating of the fault,
- The suggested priority for fixing the faults,
- The proposed corrective action,
- The estimated cost to repair on a planned and unplanned basis, and
- The potential cost avoidance if the corrective action occurred on a planned basis.
Assigning a severity rating for each equipment fault helps prioritize the corrective actions. The severity ratings and potential difference in planned and unplanned costs provide input on which corrective action is selected to be performed on any given planned shutdown. The Fullerton Mill severity rating system is listed below:
- Class I – A minor fault may or may not exist; no immediate action required.
- Class II – A known fault exists in the equipment, and the corrective action should be taken during the next opportunity.
- Class III – A known fault exists in the equipment, and the correction action must be taken during the next opportunity.
- Class IV – A known fault exist in the equipment, and the asset must be shut down immediately to address the fault.
The bad actor list makes the team aware of equipment with faults or pending failures. The asset team can then make note of any changes to the equipment condition, such as increased noise, heat and vibration. Any of these changes could cause the acceleration of the schedule to perform the corrective actions through condition-based maintenance.
The bad actor program procedures were formalized in a written document for the mill. The bad actor program from the Fullerton Mill was then used as a model to create the framework for the entire sector.
Metrics – How to Measure Performance?
Numerous metrics can be used to measure asset reliability. Before the reliability office and condition-based maintenance, only total delay, cost per ton and total tons produced were used to measure asset reliability. The reliability office adopted many metrics to track asset performance. Some of these metrics are listed below.
- Mean time between failure
- Total unplanned delay (electrical, mechanical, process and utilities)
- Mean time to recover
- Total delay
- Bad actor cost avoidance
- Route completion
- Total mill average vibration
- Oil cleanliness
Why so many metrics? Each metric had a different audience and was meant to convey a different message. Given the makeup of the reliability office and its focus on electrical and mechanical equipment, the metrics used most often and the easiest to understand are total unplanned electrical and mechanical delay, and bad actor cost avoidance.
Total unplanned electrical and mechanical delay can be related to the performance of the condition-based maintenance programs and the performance of the entire maintenance team. All delay events are recorded and characterized by the primary reason for asset shutdown. The reasons for delay events are entered by operators. The selection of these reasons has been formalized into a common delay tree for all assets in the sector. The final reason for each unplanned delay event is either electrical, mechanical, process, utilities or unknown. Unknown is discouraged as a selection because it does not help identify any repetitive problem areas or equipment.
While total unplanned electrical and mechanical delay can be an indication of performance, the metric that demonstrates the true impact of the condition-based maintenance programs is bad actor cost avoidance. This metric has the units of dollars. Bad actor cost avoidance is the difference in cost to repair equipment on a planned basis as opposed to an unplanned basis. Equipment is going to fail, but how and when it is repaired can make a significant difference in the morale of the asset team and signify the maintenance culture at the site.
Some additional work is required to perform these calculations, in particular the unplanned cost estimate. The reliability office developed the model for unplanned cost based on the inputs below:
- Actual SAP data
- Cost of components
- Hours confirmed to work orders
- Industry studies for increased time and cost to perform work on an unplanned basis
- 30 percent more time to complete the work
- 50 percent more cost for components
- Cost per hour for the asset when down
- Waste created during shutdown and startup
- Union collective bargaining agreement
The difference in costs can be used to determine the site’s cost ratio for planned to unplanned work. This ratio can be employed as a quick estimate of the true cost of letting equipment operate to failure. Most sites are good at estimating the cost of components and the cost of labor to perform repairs, but the cost ratio shows the impact of allowing (purposely or not) the equipment to run to failure.
Another use of the bad actor cost avoidance metric is to justify continued training for the reliability technicians and the acquisition of new tools. The bad actor cost avoidance provides the data to calculate the rate of return for the training and/or the new tools.
Not all metrics are effective for all audiences. Choosing the right metric for the audience can be the difference in successful communication of the condition-based maintenance effectiveness and impact.
Condition-Based Maintenance Results
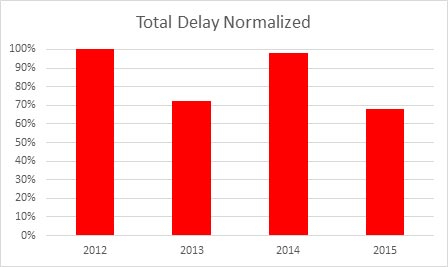
The total delay on a single tissue machine has been reduced 32 percent over the past three years, with unplanned mechanical and electrical delay reduced from 7.4 to 5.3 percent from 2014 through 2015. A significant portion of the delay in 2014 was attributed to process delay.
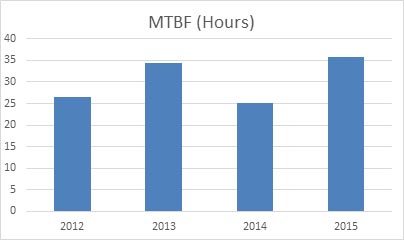
The mean time between failure (MTBF) of the tissue machines has increased by 35 percent over the past three years. A failure was defined as any event that caused the machine to stop making paper. MTBF has increased from 26.5 hours to 35.7 hours, a 35 percent increase.
Each year the bad actor cost avoidance has increased. This is likely due to the growth of the skills and experience of the technicians. The increase in this metric is an indication that the mill is moving away from reactive maintenance and towards condition-based maintenance.
Oil loss has decreased dramatically in the past four years, improving safety and reducing costs.
How Can This Be Sustained?
There is little sense in building a condition-based maintenance program that is not sustainable. Sustainability cannot be dependent upon a single person or champion. Sustainability has to come from within the group. Having the proper culture within the team and the site that will nurture and support the reliability office is most important. With the right culture, the reliability office can be a spring board to morale improvement.
A condition-monitoring network was created for the sector. The network leader conducts monthly calls with other sites to share information from failures and applications of technologies. The monthly calls address common issues across the sector and help to resolve them. Most importantly, the network allows the sites to work together to build the skills of all the technicians and to increase the value of condition monitoring across the sector.
Culture alone will not allow the gains of the reliability office to be sustainable. Team members will change over time. So how does the knowledge and practice transfer from the existing team to the new members? Written procedures and best practices for condition-based maintenance will aid in the knowledge transfer. The documents will provide a means to audit actual practices. If written procedures are followed, the data collected will be more consistent as it is gathered by the technician and will reduce data variability from technician to technician.
Documentation of each technology system can identify aspects or weaknesses that need improvement. System documentation helps with troubleshooting of the technology and processes, especially as the technology changes and improves. These documents provide models for new systems to be developed as sites add technologies to their program.
Verification of corrective actions must be conducted. Collecting data after the equipment has been repaired and dissecting the parts replaced or repaired proves that the corrective action and analysis were correct. This will build confidence of the skills and knowledge within the reliability office. The experience gained will aid in assessing the severity of equipment faults found with condition monitoring.
Marketing the reliability office’s skills and successes with condition-based maintenance will show the value of its work and that the mill views its work as important to the site’s longevity. Some methods for marketing the reliability office include publishing root cause failure analyses and communicating the improvements in delay and mean time between failure or bad actor cost avoidance totals.
The true sustainability of the reliability office will occur when its practices are firmly entrenched in the site and maintenance culture, where all failures are known before they occur and effective countermeasures are employed after the root cause of the failure has been identified.
The Future
The reliability office continues to look to expand its repertoire with more condition-based maintenance technologies. In the near future, the team will be including ultrasound, borescope and motor current analysis.
We have already begun using ultrasound and borescopes, but our skills are not well-developed. Ultrasound will expand to air surveys and lubrication. Borescope skills and confidence will improve with practice. Motor current analysis is in the state of exploration. The lack of an electrical engineer in the reliability office is slowing this effort.
The reliability office will eventually expand to cover the entire mill. To be successful mill-wide, more personnel will be required, and autonomous care must be employed.
Of course, there are more aspects to the site’s revitalization than the reliability office. Culture is difficult and slow to change. The reliability office and the wins it brings to the site are a large part of the culture change and the mill’s reliability improvement. The future looks bright for the mill, as it continues to improve each year.
This article was previously published in the Reliable Plant 2016 Conference Proceedings.
By Jeffrey Ng, Kimberly-Clark Corporation